Three thoughts on the JPMorgan (JPM) trading fiasco

1. Black box finance. In our latest letter, we described how financials led the market for the first quarter and yet, we reminded clients that we don’t own any depository financials.  We wrote:

“As we hinted in our first page introduction, we are not particularly bullish on depository financials (i.e. banks).  The community banks have too much capacity, significantly limiting growth.  The large ‘money-center’ banks are subject to vast new legislation by the name of Dodd-Frank that we believe will significantly reduce their returns relative to historical trends.  In addition, the big banks are essentially black boxes.  They may trade below stated book value, but does anyone, including the CEOs and CFOs of these immensely complex institutions with their myriad derivative positions, really know what book value is?

If yesterday’s revelation by JPMorgan CEO Jamie Dimon regarding unforeseen trading losses in their risk management group is not enough empirical evidence to close the case on our point, we don’t know what is.

With highly levered banks, the black box could include positions that completely wipe out equity holders.  This thinking on “money-center” banks is not new – we’ve continually emphasized it in both written and oral communications with clients for several years.  All investors need to cope with uncertainty but our primary objective is to protect capital, so if there is a meaningful possibility of total loss we will pass. This framework is a hallmark of our investment process. We participate when the range of possible outcomes are all positive, or (for very small positions) when the probability weighted expected outcome is very high.  Potential returns between 6% and 12% (see Excelon), are acceptable.  Potentially being wiped out is not.

2. Jamie Dimon. Jamie Dimon remains an impressive leader.  Frank, tough, and seemingly fair, he has built a career and a bank by methodically putting one foot in front of the other, taking the long view, and (for the most part) acting conservatively.  There is a positive potential outcome of this event.  If this causes Mr. Dimon to recognize the vast gulf between a 2 trillion dollar bank’s operations and his ability to monitor and control these operations, this event will guide the direction he takes the bank.  JPMorgan would become a better institution.  In addition, there is some chance that his approach to this issue will further enhance his stature as a banker and a leader.  His frank mea culpa yesterday was a start in this direction.

3. Ben Bernanke. The primary culprit here does not receive a JPMorgan paycheck nor work in Manhattan (or London).  Rather, his check is signed by Uncle Sam and his office is at 20th & Constitution Avenue in Washington, DC.  While it is still unclear exactly what positions JPMorgan held and holds in its CIO office, financial repression a la Ben Bernanke is likely the root cause of JPMorgan’s current mess.  The “London Whale’s” trading activity was just a natural reaction by a profit seeking financial institution to zero interest rates.  Bernanke dangled the bait and the whale took it.  The Federal Reserve has stated that a primary goal of their financial repression is for investors to “step out on the risk curve” (i.e. microscopic Treasury bill yields force investors to take risk to increase their yield; moving to longer durations, corporate credits, equity, leveraged derivatives, etc.).  Like all central planners before them, this Federal Reserve ignores the law of unintended consequences at citizens’ peril.

The information contained herein should not be construed as personalized investment advice.  Past performance is no guarantee of future results.  There is no guarantee that the views and opinions expressed in this blog will come to pass.  Investing in the stock market involves the potential for gains and the risk of losses and may not be suitable for all investors.  Information presented herein is subject to change without notice and should not be considered as a solicitation to buy or sell any security.
With Power Prices at a Multi-year Low, We’re Looking at Excelon Corporation (EXC)

At a current price in the mid $38s, we think Excelon Corporation (EXC) provides investors a steadily growing 5.4% dividend yield with a “free call option” on rising power prices.

With the just completed acquisition of Constellation Energy, EXC became the largest power retailer in the United States.  At $38.50 and a dividend of $2.09, the stock trades with a 5.4% current yield.  The dividend is well covered with estimated trough 2012 earnings of $3/share (a payout ratio of 70%).

EXC is essentially two distinct businesses.  The first is a regulated utility that earns a fixed return.  The second is a merchant power generator that sells power on the open market.  EXC’s power generation is primarily nuclear.  With current power prices near multi-year lows, we expect one third of 2012’s earnings (and half of EBITDA) to come from the regulated utility side of the business.  This is a very stable, slow growth business.  The regulated utility will likely earn a 10% return on equity (set by regulators) and grow earnings at 5% a year through growing its “rate base” (i.e. property, plant, and equipment).

Absent any improvement in power prices, we would expect to earn a 6-12% annualized total return on our EXC investment.  Current market expectations for future power prices and the extent to which EXC “locks in” their future selling prices will determine where in the 6-12% range our returns fall.  If future power price expectations were to match today’s low levels, our return would be closer to 6%.  If EXC were to “lock in” their sales at today’s future price expectations (the market expects prices will be higher next year and the year after), we would earn closer to 12%.  Either way, this is a significantly better return than we expect from the S&P 500 from the current, 1400 level.  We would also expect the business to be less volatile than the overall US economy and the stock’s price level to be less volatile than the S&P 500.  EXC fits several of the “high-quality” business dynamics we described in our fourth quarter 2011 quarterly letter.  But that is not the end of the story.

Power prices are near multi-year lows primarily because natural gas prices are at multi-year lows.  Natural gas provides the majority of peak usage power in the US and thus determines domestic power prices.  When demand for power increases above a certain threshold, natural gas power plants come online and provide power.  Nuclear is one of the lowest cost sources of power and thus when power prices increase, EXC’s margins expand.

Natural gas prices are at multi-year lows because of the recent shale gas revolution.  In the mid to late 2000s, entrepreneurs and engineers discovered technology and techniques to extract significant quantities of gas from sources that were never accessible before (cost effectively).  This has led to a massive increase in natural gas supply as lessees were required to drill in order to hold leases (even if the drilling was not economical).

Commodity prices typically trade at their marginal cost of production.  Reasonable estimates of all in cash costs for natural gas are closer to $6/mmBTU than the current $2.50/mmBTU spot price.  We believe there are three primary drivers that will lead to higher natural gas prices over the next few years:

  1. As leases become established, uneconomical drilling will likely stop.
  2. When new Environmental Protection Agency (EPA) rules go into place in 2015, a large number of old coal-based power plants will become uneconomic and thus come offline.  This will increase demand for natural gas.
  3. When the economy begins to recover (albeit very slowly by our analysis), a rise in industrial production will also increase the demand for natural gas.

Increased power prices could easily lead to $5/share earnings for EXC and a stock price of $50-60/share.

Outlook:  long EXC.

The information contained herein should not be construed as personalized investment advice.  Past performance is no guarantee of future results.  There is no guarantee that the views and opinions expressed in this blog will come to pass.  Investing in the stock market involves the potential for gains and the risk of losses and may not be suitable for all investors.  Information presented herein is subject to change without notice and should not be considered as a solicitation to buy or sell any security.

A complete list of recommendations by Grey Owl Capital Management, LLC may be obtained by contacting the adviser at 1-888-473-9695.

The Time to Prepare for Today’s Volatile Markets Was Long Ago

The S&P 500 peaked this year on May 2nd at 1371 (intraday).  The current selloff began on July 7th just slightly lower at 1356 (again, intraday).  From the close on July 7th through today’s close (August 8th), the S&P 500 (as measured by the SPDR S&P 500 ETF)(1) was down 17.20% on a total return basis to 1119.

While the media has recently been filled with stories fomenting panic (about the European debt crisis, the recent US debt-ceiling political argument, and now S&P’s lowering of the US’s credit rating) and suggesting all sorts of portfolio strategies, the time to prepare for increased volatility and lower equity prices was long ago.  These crises did not appear out of thin air and are not really crises in and of themselves.  Rather, they are symptoms of underlying issues that have been building for some time, in plain sight.  The Fed was trying to trick investors with zero percent interest rates into ignoring the problems, but eventually that had to give.

We have long been advocating portfolios built primarily around higher quality investments and reserving some cash or “dry powder” for a time when securities would likely sell at better values.  Our rationale was based on the following:

  • Broad equity market valuations were and are too high.  We discussed a basic methodology for valuing broad markets in detail in our fourth quarter 2009 letter when the S&P 500 was also in the mid-1100s.
  • Developed market sovereign debt has reached unsustainable levels relative to GDP which will likely lead to increased volatility and inflation (though deflation is a potential too).  We discussed the issues of sovereign risk in our first quarter 2010 letter.
  • The US economy has been supported by fiscal and monetary stimulus and will atrophy when the steroids are eventually removed.  Our first quarter 2011 letter tells this story in pictures.

While the last month is merely a short battle in a long war, we are pleased that our typical equity (or “risk”) account’s losses  were limited to 10.65%(2) during this period; only 62% of the S&P 500’s 17.20% loss.  An important element to increasing long-term compounded growth is to minimize drawdowns.  Our equity portfolios have behaved as designed.


1. The SPDR S&P 500 ETF (“SPY ETF”) is used for comparing performance on a relative basis. There are significant differences between the SPY ETF and our accounts, which do not invest in all or necessarily any of the securities that comprise the SPY ETF.

2.  This is an intra-month estimate reflective of one account invested in our model and is not representative of all clients. While clients were invested in the same securities, this performance does not reflect a composite return.The return presented is net of all adviser fees and includes the reinvestment of dividends and income. Clients may also incur other transactions costs such as brokerage commissions, custodial costs, and other expenses. For the most recent performance, please visit www.greyowlcapital.com or call us at 703-459-9400.

THE RETURN SHOWN REPRESENTS PAST PERFORMANCE AND IS NO GUARANTEE OF FUTURE RESULTS. NO CURRENT OR PROSPECTIVE CLIENT SHOULD ASSUME THAT FUTURE PERFORMANCE RESULTS WILL BE PROFITABLE OR EQUAL THE PERFORMANCE PRESENTED HEREIN.

We’ll Buy a “Poor” Capital Allocator Like Microsoft Anytime

Microsoft (MSFT) is as out of favor as out of favor can get.  Apple adds “i” to the word “Cloud,” talks about it at a developer conference, and Steve Jobs is on the front page of the Financial Times.  Microsoft releases the fastest selling operating system of all time (Windows 7) and then the fastest selling consumer device in history (the Kinect) and newspaper editors and investors alike just yawn.  Microsoft can’t innovate, Steve Ballmer inherited a great company but hasn’t really done anything to move it forward, and he allocates capital poorly with dumb acquisitions (Skype) and silly R&D projects (Kin One and Kin Two).

Despite this, or perhaps because of it, we think Microsoft is a spectacular investment opportunity.  We have owned Microsoft for several years, trading around the position multiple times.  Today it is one of our largest positions.  We articulated our thesis at length in a recent quarterly letter.  In this brief post, we want to take a look at the claim that Mr. Ballmer has been a poor allocator of capital.

Last week, David Einhorn presented his investment thesis for Microsoft at the Ira Sohn Conference.  He was bullish on the stock.  He said it is very cheap on both an absolute basis and relative to the market and yet the business is outperforming the average S&P 500 company by a wide margin.  Mr. Einhorn believes Microsoft is cheap for a reason.  He argued that the number of poor capital allocation decisions on the part of Steve Ballmer has overwhelmed the superior operating performance and good decisions that have been made.

It seems clear that Steve Ballmer IS an “overhang” on the stock as Mr. Einhorn phrased it.  The stock would likely appreciate if he was to move on.  However, the question of whether Mr. Ballmer truly is a poor capital allocator seems less obvious to us.  Remember, it isn’t his fault that the market irrationally bid the stock up to a PE of 70 right when he took over as CEO.  So, you can’t judge him on stock performance alone.  In addition, we think that the sheer size of Microsoft can cause confusion.  Skype may or may not turn out to be a good acquisition.  If it is a mistake, the $8.5B price would seem to make it a big one.  But, it is only 4.5 months of free cash flow to Microsoft.  What has Mr. Ballmer done with the rest of Microsoft’s cash?

From a base of $10.5B in 2000, Microsoft grew free cash flow (i.e. operating cash flow less capital expenses) to $22B in 2010.  This is a CAGR (compound annual growth rate) of 7.7%.  The total free cash flow generated over this ten year period was $155B.  During that same period, Microsoft returned to shareholders $142B in cash via dividends and stock buybacks.  In other words, Microsoft returned 92% of all the cash they generated to shareholders!

Let’s now use this information to perform a brief thought exercise.  Today, you can purchase Microsoft stock for $24/share or you can buy the entire company for $203B.  Imagine you were to buy the entire company today.  Next, imagine that Microsoft were to grow free cash flow at the same rate for the next ten years that it did for the previous ten years.  This means the firm would generate $360B in free cash flow over the next ten years.  Given the firm’s historical need to retain very little capital, further imagine that 92% of all cash generated was returned to shareholders.  Let’s assume it is all in the form of share buybacks so we don’t need to worry about taxes.  At this point you would have received 1.6x your money back AND you would still own the entire business that is Microsoft:  whatever it is that becomes of a cloud development platform (Azure), software as a service (Office 365 and Dynamic CRM), home entertainment (XBox, Kinect, XBox Live), etc., etc.  Hmm… maybe Mr. Ballmer has presided over some innovation.

If those are the available investment dynamics, one could certainly do much worse.  Perhaps that is exactly Mr. Einhorn’s point.  If you buy Microsoft today, you likely get the above investment dynamics.  You also get a free call option on Mr. Ballmer’s departure.

The information contained herein should not be construed as personalized investment advice.  Past performance is no guarantee of future results.  There is no guarantee that the views and opinions expressed in this blog will come to pass.  Investing in the stock market involves the potential for gains and the risk of losses and may not be suitable for all investors.  Information presented herein is subject to change without notice and should not be considered as a solicitation to buy or sell any security.

A complete list of recommendations by Grey Owl Capital Management, LLC may be obtained by contacting the adviser at 1-888-473-9695.

Claims of the “Death of Stock Picking” Are a Good Sign for Value Investors

A recent Wall Street Journal article highlights the macro-driven nature of today’s stock market.  In it, long-time value investors lament the current environment where stocks appear to trade in unison based on unemployment data or European bank stress test results.  If stocks are driven by macro factors instead of individual company fundamentals, stock pickers can’t get an edge.  Market strategist James Bianco of Bianco Research asserts “stock picking is a dead art form.”  Macro hedge-funds are opening at a rate equivalent to that of traditional stock funds and the big asset management firms are even launching macro mutual funds.

We think stock-picking is very much alive.  In fact, we recently wrote a 20-page investment guide that details a bottom-up approach for today’s environment.  Call us contrarian, but we couldn’t think of a better sign than this article that fundamentally-driven, bottom-up stock-picking is likely to make a comeback sooner rather than later.  Didn’t the commodity bubble burst right around the time that the asset management firms were rolling out a new commodity fund or ETF every week?  Moreover, didn’t “the death of equities” cover stories in the early 1980s signal the start of a 20+ year bull market for stocks?

The Wall Street Journal article presents data that shows the correlation of stocks in the S&P 500 between 2000 and 2006 was 27% – quite a bit of disparity indicating undervalued stocks could appreciate and overvalued stocks could depreciate as opposed to trading up or down in unison.  The article also points out that correlation spiked to 80% during the credit crisis and again more recently during the European sovereign debt scare.  As these issues petered out, correlations never dipped below 40% and today hover around the mid 60s.  However, the article does not point out the length of time over which the correlations were measured – days, weeks, months?

The time period over which the correlation is measured is critical.  “Time arbitrage” has proven to be a very effective investment strategy.  Who cares if individual stocks are correlated over days and weeks when your investment horizon is years?  Glenn Tongue (one of the Ts in T2 Partners along with Whitney Tilson) highlights this fact in a recent appearance on Yahoo! Finance.  Like us, the partners at T2 believe buy-and-hold stock picking is far from dead.  Mr. Tongue also makes a critical point about matching the duration of the investment strategy and the investors.  This is why we work very hard to ensure our investors understand our process before they become clients.

Don’t misunderstand our view.  We agree the data shows a significant increase in correlation between individual stocks (and we witness this as we watch the market and our individual names on a daily basis).  We also agree that the macro backdrop driving the market will remain for some time.  The over-leveraged PIIGS, US federal and local governments, and the US consumer will likely take years to adjust to sustainable levels.  In addition, the massive government intervention in fiscal and monetary policy does not appear to be subsiding with Bernanke and company preparing for QE2’s maiden cruise.  (We have discussed these issues at length in several of our recent quarterly letters.)  The market will certainly react to macro factors over short time periods, but that doesn’t mean significantly undervalued stocks or significantly overvalued stocks won’t gravitate toward fair value over a longer period of time.

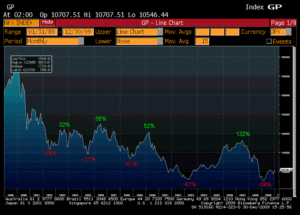
In our recently published investment guide titled How to Prosper in Volatile and Range-Bound Markets we detail the strategy we are employing to deal with the current environment.  We believe a concentrated portfolio will be more likely to outperform – a few deeply discounted names that are returning capital to investors (via share repurchases or dividends) and that also have a catalyst can outperform even if the majority of the market moves in unison.  In addition, the flexibility of corporations to deal with macro shocks (be they slower growth, inflation, government regulation) means equities have a better chance of outperforming government bonds, currencies, or commodities (areas macro funds are more likely to play in).  Finally, we think valuation-based timing will be more important than it has been for traditional stock pickers.  While Japan’s macro-driven market now trades at close to a quarter of its peak value 20 years ago the market experienced four rallies and five sell-offs of greater than 30% over that period.  That type of volatility creates terrific opportunities for value investors to increase exposure as the macro shock of the day creates fear and to pare exposure as the fear fades away.

For a more detailed overview of our approach, you can download our full 20-page investment guide here:  www.greyowlcapital.com

Is Japan the Correct Analogy?

Yesterday’s Financial Times featured an analysis by Lindsay Whipp titled “A gloomy anniversary for the Nikkei.”  Most investors already know the punchline:  The Nikkei, Japan’s primary stock market index, reached a peak of 39,000 twenty years ago.  Today, the index hovers in the mid-10,000s, almost three quarters below its peak.  Given the United States’ similar issues with high levels of debt, stock market (over) valuation, as well as similar monetary and fiscal responses to “fix” the initial credit crisis, investors in US equities should ask the question, is Japan the correct analogy?

Unfortunately, in many ways Japan does appear to be a reasonable corollary.  Post World War II, from 1950-1970, Japan’s GDP grew at a real rate of 8.4% annually on a per-capita basis.  It slowed to a still stellar 4.1% rate from 1970-1990.  Then, the bubble burst and from 1990-2004 Japan’s economy grew at an average rate of 1%.  The Japanese market’s slow bleed has led to a -6.4% annualized return over this period.

What happened?  Similar to what we just experienced in the US, the late 1980s in Japan saw monetary inflation that led to tremendous asset price inflation in both residential real estate and equity markets.  The government reaction after the bubble burst was very similar to the US government’s reaction to date.  The Japanese government propped up insolvent banks and built bridges to nowhere.  It redistributed existing wealth rather than allowing creative destruction to work its magic by purging excess and encouraging new development.  While Japan did use monetary policy to combat deflation, it was far less aggressive than the US has been to date and a period of mild price deflation has persisted.

The economic ramification of the analogy are clearly quite negative, but there are several additional insights investors might find useful:

  • Valuation matters.  Despite very poor overall stock market returns for the period of -6.4%, our friends at the Applied Finance Group demonstrate here (slide 15) that investors who purchased the “cheapest” quintile of stocks each year were able to achieve a 6% positive return thus beating the “market” by over 12% annually.
  • Overvaluation, leverage, and excessive government intervention lead to volatility.  Volatility creates opportunities as the following graph shows with the Japanese market experiencing 5 sell-offs of greater than 30% and 4 rallies of greater than 30% over the twenty year period.
  • Unlike Japan, the US Federal Reserve has an incentive-caused bias to inflate.  One might conclude that Japan got mild deflation because that is exactly what they wanted.  Japan is a nation of net-savers, while the US is the largest debtor nation.  Savers loath inflation because the value of their bond coupons become less and less valuable.  Debtors love inflation because the value of their debt is less and less.  (Now, before one concludes that the Fed’s aggressive monetary policy will be our saving grace, it is important to remember that real growth is all that matters from the standpoint of wealth and improved living standards and all that inflation achieves is nominal growth with the very negative side-effect of mal-investment.)

In conclusion, we think that while not a perfect analogy (owing to distinct demographic, immigration, and consumer behaviors to name just a few differences), the last twenty years in Japan provide a very useful template to inform current investment decisions in US markets.  We believe a process that is oriented toward value investing, displays the patience to wait for the market to present opportunities, and is mindful of the damaging impact of an unstable currency has the potential to offer both positive absolute and relative returns in even these very challenging conditions.

Financial Advisers Exhibit Harmful Bias Too

The May/June edition of the CFA Institute’s Financial Analysts Journal features the article, “Should Good Stocks Have High Prices or High Returns?”  Not withstanding the ambiguity of the term “good,” the logical answer to the question is that the fair price for any investment is the future stream of cash flows the investment will provide, discounted at a rate that incorporates the expected natural rate of interest over that time period and a risk-premium to account for the possibility that the cash flows don’t occur (or the timing changes, etc.).

The article goes on to define “good” using several metrics.  One metric is the amount of leverage a firm has – low is good, high is bad.  The higher the leverage, the greater the possibility the firm goes bankrupt and the future cash flows don’t occur.  So,  based on this definition of “good”, a “good” stock should have a higher price and a lower return.  Think about it this way:  A given firm’s equity should have a higher return than the same firm’s debt because (among other reasons) the debt gets paid first and therefore has a higher probability of being paid.  All else being equal, a firm with lower leverage has a smaller chance of bankruptcy than a firm with higher leverage and thus a greater probability of paying the expected cash flows.  Thus, the risk premium should be lower and the expected return lower for a firm with less leverage.  The article highlights empirical evidence that bears this out.

Here is where it gets scary:  When asked about this issue, professional financial advisers gave diametrically opposed answers depending on how the question was asked.  When asked if they required a higher rate of return for a stock with higher leverage, 86.2% of advisers said yes.  When asked if they expected a higher rate of return for a stock with higher leverage, only 12.5% of advisers said yes.  Advisers are clearly prone to many of the same behavioral biases that affect laymen.

Two important conclusions can be drawn from the article:

  1. Aspects of the stock market are NOT efficient.  When professionals answer the same question regarding valuation with opposite answers depending on how the question is framed, mis-pricings will abound.
  2. When seeking investment advice:  caveat emptor.  As the article states, “avoiding investment mistakes is one of the leading reasons for using the services of financial advisers.  The value added from the advice, however, is compromised if the advisers are subject to the same biases as the individual investors.”

The Concept of Duration is not Just for Bonds

Many fixed income investors are familiar with the concept of duration.  It generally represents the change in the value of a bond that results from a 1% change in interest rates.  If interest rates go up by 1%, a bond currently priced at par (100) with a duration of 5 will go down in value by 5 to 95.  Check out Investor Words for a more detailed discussion.

Before we dig deeper into the application of duration to equities other than bonds, we need to take a brief digression for a quick refresher on asset valuation.  In a pure sense, investments are worth the net present value of all of the future cash flows the investment will provide.  The net present value is calculated by discounting each of the individual cash flows back to today using some interest rate.  If my discount rate (or interest rate) is 5% and I am going to get $100 tomorrow, what is that investment worth to me today?  $95.24.  Here’s the math:  $100/((1.00+5%)^1).  So, we can think about duration as the impact of changing the discount rate we use to calculate the net present value of an asset’s future cash flows.

With that background, let’s take a look at how duration applies to equities.  Equity investments have a much longer duration than fixed income investments because there is no set date for a return of principal.  An equity investment’s dividends could continue to grow and pay ad infinitum.  Therefore, equity investments are much more sensitive than fixed income investments to changes in the discount rate (i.e. the interest rate as described above).  Within equities, a stock that pays a very high dividend and whose price implies little growth (e.g. Altria, MO) will have a much lower duration than an equity that pays no dividend and whose price implies substantial growth (e.g. Google, GOOG).

As we articulate in our most recent quarterly letter, we believe the current economic environment has the potential to leave corporate earnings volatile for some time and to increase the volatility of inflation, both of which could lead investors to increase their discount rate.  So, all things being equal we believe equity investments that pay high dividends compared to those that pay no dividends and whose prices imply very high growth will outperform the overall stock market.

To illustrate why the duration on an equity is much higher than that on a bond, let us look at a couple of examples.  First, assume we are talking about a Treasury bond with a 5% coupon and 5 years until the bond matures.  Also, assume that the risk-free interest rate is currently 5%.  As illustrated in the table below, the net present value of that bond is 100.  We get to this value by discounting the bond’s annual coupons and the final return of capital at the risk-free rate.

Basic Bond Example
Basic Bond Example

Now suppose we purchase that bond for 100.  Immediately, new economic news comes out and the risk-free interest rate moves to 6%.  How much is our bond now worth?  The answer is 95.79(1).  The following table illustrates the changes in the value of the discounted cash flows based on the new 6% discount rate, as opposed to the old 5% discount rate.

Bond Example with Increase Interest Rate
Bond Example with Increased Interest Rate

Now that we have seen why a change in interest rates changes the value of a bond, we turn to an example of an equity.  Below, we model an equity investment that pays a 2% dividend which we think will grow at 3%.  The risk-free rate is back to 5%, but now we add in a 3% equity risk premium.  The net present value calculation tells us that an investment with these characteristics is worth 63.91.  Notice that the cash flow for the residual value is highlighted.  Unlike a bond, an equity investor is not promised a return of principal.  The residual value of the equity that exists beyond the 5 year period we have chosen to model is just the present value of the future dividend stream that we can expect a new investor to pay.  (The formula for the residual is a perpetuity:  dividend/(discount rate – growth rate).)

Basic Equity Example

Rather than change the risk-free rate, we increase the equity risk premium in the final example below to demonstrate that an equity investment with these characteristics has a duration of almost 25.  A 1% increase in the equity risk premium changes the net present value of the investment to 48.03.  (48.03 is 25% below 63.91.)  Notice how sensitive the value of an equity investment can be to the discount rate.  Valuing an equity investment is a very imprecise process which is why it is important to have a very large margin of safety (i.e. an undervalued asset) before making an investment.

Equity Example with Increased Risk Premium

In conclusion, we believe the concept of duration is just as relevant when thinking about equity investments as it is when thinking about interest rate risk and fixed income investments.  For a more detailed analysis of the impact inflation has had on the equity risk premium, review Ed Easterling’s work here.  For further reading on equity duration, both Ben Inker of GMO and John Hussman of the eponymous Hussman Funds have explored this concept as it applies to the overall stock market.  Their analysis is worth reviewing.  If you would like to play along at home, you can download the spreadsheet model we used in this analysis here.


1 Careful readers will note that the 1% interest rate increase led to a 4.21% decrease in the value of the bond, NOT a 5% decrease.  This is because a 5-year, 5% coupon bond has a duration that is slightly less than 5.  A zero-coupon, 5-year bond would have a duration of exactly 5.  This is because as an investor receives each coupon, that portion of the value is no longer subject to the new interest rate.