(This article first appeared on Seeking Alpha on Jan 31, 2014.)
For the past few months, cautious investors, perma-bears, or reasonable skeptics (depending on your point of view) have emphasized the rise of margin debt balances to historic highs as one more sign that “all the passengers are on one side of the boat.” In a January 27 post, Zero Hedge’s “Tyler Durden” wrote, “margin debt rose by another $21 billion in December to an all time high of $445 billion, and up 29% from a year ago.” He goes on to explain how grossly understated this number is given hedge funds’ ability to borrow beyond traditional margin limits. Dr. John Hussman of the eponymous Hussman Funds wrote of surging margin debt at least as far back as April, 2013. Even the more staid Wall Street Journal has published warnings about the rise in margin debt. For example, the October 24, 2013 Morning MarketBeat was titled Risky Business of Rising Margin Debt.
Yet, in a December 20, 2013 commentary, technical analysis service Lowry Research Corporation points out that “since market tops are always a reflection of excessive risk-taking, it is reasonable to expect margin debt to be at high levels near major market tops. But, that does not mean it is an effective or accurate tool for anticipating major market tops. History shows that margin debt was at record levels for each of 19 years, from 1950 to 1969 and for each of 25 years, from 1976 to 2000.”
So, does margin debt matter? We believe the answer is yes. While it may not be a useful tool for market timing, it does help to describe the general stability of the financial system – particularly when viewing margin debt expressed as a percentage of a normalizing variable such as gross domestic product (GDP). The greater the margin debt as a percentage of the system, the less stable the system is.
Why is margin debt destabilizing? There are several reasons:
- Margin debt is a loan that can be called at any time. Imagine how precarious the housing market would be if your bank could call you on Monday morning and tell you to pay off your mortgage by the middle of the week or they would start selling the windows and doors on your home.
- The higher margin debt becomes as a percentage of financial assets, the smaller the selloff in financial assets needed to cause the margin clerk to make the above-described call. Traditional margin loans are governed by Regulation T. This allows investors to borrow against 50% of their capital initially. Therefore, an investor with $100 could make a $200 investment. Importantly, the investor must maintain at least a 25% capital ratio. So, if that $200 investment went down more than 33%, the margin clerk is calling. Unfortunately, this oversimplifies the issue. Institutional investors can use far more leverage and the margin call is governed by more than just Regulation T’s maintenance requirement. If a large brokerage firm gets nervous and wants to take down their loan balance, they can make a margin call. If they don’t like the type of collateral being held (maybe momentum stocks like AMZN, or NFLX, or YELP) they can make a margin call. To use the home analogy again, it would be as if your bank could require you to repay your mortgage if they were worried a hurricane was headed towards your neighborhood.
- When margin debt is high enough, selling begets selling. It could work like this. a) Some broker-dealer(s) get over-extended by lending against a class of securities that proves to have much more downside volatile than they originally expected. As these assets selloff, the firm(s) begin to call in margin loans. b) The portfolio managers getting the margin call sell securities into a falling market in order to pay off their loans. c) The additional selling causes the market to go down more. d) Go back to a) until such time as the system is unlevered and securities are primarily owned without debt.
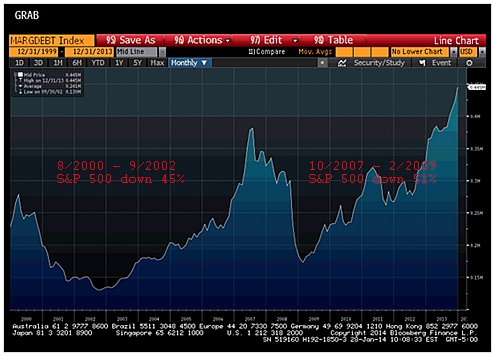
Thus, while neither absolute margin debt levels nor margin debt as a percent of GDP may be good market timing indicators, significant margin debt IS emphatically a sign that the system is unstable. We submit the following chart of the two most recent margin debt peaks as evidence.
This graph, created using Bloomberg Financial, shows the absolute dollar amount of margin debt from the end of 1999 through the end of 2013. At the margin debt trough in September 2002, the S&P 500 had fallen 45% from its August 2000 level. At the margin debt trough in February 2009 the S&P 500 had fallen 51% from its October 2007 level.
The information contained herein should not be construed as personalized investment advice. Past performance is no guarantee of future results. There is no guarantee that the views and opinions expressed in this blog will come to pass. Investing in the stock market involves the potential for gains and the risk of losses and may not be suitable for all investors. Information presented herein is subject to change without notice and should not be considered as a solicitation to buy or sell any security.
A complete list of recommendations by Grey Owl Capital Management, LLC may be obtained by contacting the adviser at 1-888-473-9695.
