The Time to Prepare for Today’s Volatile Markets Was Long Ago

The S&P 500 peaked this year on May 2nd at 1371 (intraday).  The current selloff began on July 7th just slightly lower at 1356 (again, intraday).  From the close on July 7th through today’s close (August 8th), the S&P 500 (as measured by the SPDR S&P 500 ETF)(1) was down 17.20% on a total return basis to 1119.

While the media has recently been filled with stories fomenting panic (about the European debt crisis, the recent US debt-ceiling political argument, and now S&P’s lowering of the US’s credit rating) and suggesting all sorts of portfolio strategies, the time to prepare for increased volatility and lower equity prices was long ago.  These crises did not appear out of thin air and are not really crises in and of themselves.  Rather, they are symptoms of underlying issues that have been building for some time, in plain sight.  The Fed was trying to trick investors with zero percent interest rates into ignoring the problems, but eventually that had to give.

We have long been advocating portfolios built primarily around higher quality investments and reserving some cash or “dry powder” for a time when securities would likely sell at better values.  Our rationale was based on the following:

  • Broad equity market valuations were and are too high.  We discussed a basic methodology for valuing broad markets in detail in our fourth quarter 2009 letter when the S&P 500 was also in the mid-1100s.
  • Developed market sovereign debt has reached unsustainable levels relative to GDP which will likely lead to increased volatility and inflation (though deflation is a potential too).  We discussed the issues of sovereign risk in our first quarter 2010 letter.
  • The US economy has been supported by fiscal and monetary stimulus and will atrophy when the steroids are eventually removed.  Our first quarter 2011 letter tells this story in pictures.

While the last month is merely a short battle in a long war, we are pleased that our typical equity (or “risk”) account’s losses  were limited to 10.65%(2) during this period; only 62% of the S&P 500’s 17.20% loss.  An important element to increasing long-term compounded growth is to minimize drawdowns.  Our equity portfolios have behaved as designed.


1. The SPDR S&P 500 ETF (“SPY ETF”) is used for comparing performance on a relative basis. There are significant differences between the SPY ETF and our accounts, which do not invest in all or necessarily any of the securities that comprise the SPY ETF.

2.  This is an intra-month estimate reflective of one account invested in our model and is not representative of all clients. While clients were invested in the same securities, this performance does not reflect a composite return.The return presented is net of all adviser fees and includes the reinvestment of dividends and income. Clients may also incur other transactions costs such as brokerage commissions, custodial costs, and other expenses. For the most recent performance, please visit www.greyowlcapital.com or call us at 703-459-9400.

THE RETURN SHOWN REPRESENTS PAST PERFORMANCE AND IS NO GUARANTEE OF FUTURE RESULTS. NO CURRENT OR PROSPECTIVE CLIENT SHOULD ASSUME THAT FUTURE PERFORMANCE RESULTS WILL BE PROFITABLE OR EQUAL THE PERFORMANCE PRESENTED HEREIN.
Transfer Payments – Path to Recovery or Fast-lane to Sovereign Debt Crisis?

While the increasing role of transfer payments to shore up personal income and stabilize consumer spending has long been recognized by the more circumspect economic observers throughout the recent recession and “recovery,” the observation has now gone main stream.  Last week, the USA Today ran an article titled Private pay shrinks to historic lows as gov’t payouts rise.

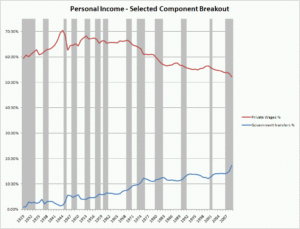
Those questioning the veracity of the term “recovery” as it applies to the current economic situation in the United States (or at least those who question the strength and sustainability of said recovery) point to the fact that absent transfer payments, real personal income is stuck at a trough level.

Why is the source of personal income important?  Earned income (from wages or investment yield) allows people to save, invest, and consume.  The government can also redistribute a portion of this income to others who are not working so that they too can save, invest, and consume.   Absent sufficient tax receipts, the government can borrow money in order to make transfer payments.  However, the government can only borrow and transfer for so long.  Eventually there needs to be real productive work that can be taxed in order to pay back the debt.

The USA Today article does a great job of presenting the facts and then presenting opinions on the implications of the facts, overtly mentioning the political orientation of the person opining.    Talk about fair and balanced.

Paul Van De Water, an economist at the liberal (the USA Today’s word choice, not mine) Center on Budget and Policy Priorities, argues that the system is working as designed – “stimulating growth and helping people in need.”  If that is the case, one would expect to be able to look at a historic chart of transfer payments and see them increase during recessions and decrease afterward.  80 years of data show that about half of the time, this is true.  However, the same 80-year chart shows a secular increase in the percentage of personal income coming from transfer payments and a mirror-image, secular decline in the percentage of personal income coming from wages.

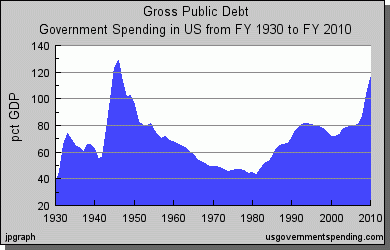
The rapid rise in gross public debt shows that the latest increase in transfer payments is not being funded from tax dollars, but rather from borrowing.  It will need to be paid back.

PublicDebt

Keen-eyed readers will note that the current level of gross public debt is not unprecedented.  A similar debt spike occurred in the 1940s as the government borrowed money to fund our efforts in WWII.  However, some of this spending built infrastructure and manufacturing assets that were later retooled from war use to productive commercial use.  One can’t say the same of transfer payments that mostly fund consumption.  Perhaps more importantly, the gross public debt in the late 1940s was near an exhaustive accounting of public debt.  Today, there is an order of magnitude more debt ($100T) held “off balance sheet” in the form of “unfunded liabilities” for future promised transfer payments.

It is unclear if we have reached a tipping point, but we know for sure we grow closer by the day.  Uncertainty abounds – investors must remain nimble.

You want China to float the Yuan (RMB)? Be careful what you wish for…

On Monday, a bipartisan group of 130 members of the U.S. House of Representatives sent a letter to Treasury Secretary Timothy Geithner and Commerce Secretary Gary Locke urging the agencies to use “all available resources” to end what they view as damaging currency manipulation by China.  The full text of the letter can be found here:  http://wallstreetpit.com/19954-china-manipulates-its-currency-say-130-congressmen

The letter states “By pegging the renminbi (RMB) to the U.S. dollar at a fixed exchange rate, China unfairly subsidizes its exports and disadvantages foreign imports”.   True, but who do they think is benefiting from the subsidy?  The congressmen are overlooking the fact that by allowing Chinese manufacturers to sell goods for less it allows American consumers to BUY goods for lower prices.  It is the U.S. consumer that is ultimately receiving the subsidy, not Chinese manufacturing companies.  Be careful what you wish for: a higher RMB/USD exchange rate would lead to higher real costs for all U.S. consumers.

These Congressmen are playing up to concerned workers, while ignoring the fact that every single one of their constituents that purchases goods made in China benefits from this subsidy.  The letter states that “China’s exchange-rate misalignment threatens the stability of the global financial system by contributing to rampant Chinese inflation and accumulation of foreign reserves.”  Where do they think the inflation will go if not to China?  It would stay here, is where.  In 2009, the U.S. trade deficit with China was $226 billion.  Personal consumption expenditures were a bit over $10 Trillion.  So, the trade deficit with China was 2.2% of personal consumption.  If the RMB were to appreciate by 20%, it would amount to an increase in costs of $45 Billion or .4% of personal consumption.  This back-of-the-envelope calculation indicates that a 20% increase in the RMB would increase consumer price inflation by roughly .4%.   Be careful what you wish for: a higher RMB/USD exchange rate would lead to higher inflation in the U.S.

The direct assertion of the letter is that if the U.S. places tariffs and regulations on China then the goods being manufactured there will be manufactured in the U.S. and put unemployed workers back to work.  In reality the U.S. and China are not the only place where commerce can flow.  In all likelihood, restricting the flow of goods from China will lead to those goods coming in from other lower cost countries like India, Mexico, or Malaysia.  Are we then going to place tariffs and restrictions on imports from EVERY country in an effort to reduce unemployment?  This might be popular with the press, but it would  act like a large tax on consumers.

The final unintended consequence of pushing the Chinese to revalue their currency relates to the large “accumulation of foreign reserves” by the Chinese.  China has used $889 Billion of their reserves to purchase U.S. Treasury obligations, making them the largest foreign holder of our debt.  This is up from $739 Billion just one year ago.  In the absence of China’s willingness to acquire our excessive debt, the United States would have to pay higher interest rates to attract other lenders.  Be careful what you wish for: a higher RMB/USD exchange rate would lead to higher risk-free interest rates, which impacts rates for almost every borrower.

In summary, strong-arming China to revalue their currency, while perhaps politically popular, would have several adverse unintended consequences: higher real costs, higher inflation, and higher interest rates.  We say, let the Chinese continue to peg the RMB to the U.S. dollar.  On balance it is considerably more helpful than hurtful to the U.S. at China’s expense.  Be careful what you wish for.

Is Japan the Correct Analogy?

Yesterday’s Financial Times featured an analysis by Lindsay Whipp titled “A gloomy anniversary for the Nikkei.”  Most investors already know the punchline:  The Nikkei, Japan’s primary stock market index, reached a peak of 39,000 twenty years ago.  Today, the index hovers in the mid-10,000s, almost three quarters below its peak.  Given the United States’ similar issues with high levels of debt, stock market (over) valuation, as well as similar monetary and fiscal responses to “fix” the initial credit crisis, investors in US equities should ask the question, is Japan the correct analogy?

Unfortunately, in many ways Japan does appear to be a reasonable corollary.  Post World War II, from 1950-1970, Japan’s GDP grew at a real rate of 8.4% annually on a per-capita basis.  It slowed to a still stellar 4.1% rate from 1970-1990.  Then, the bubble burst and from 1990-2004 Japan’s economy grew at an average rate of 1%.  The Japanese market’s slow bleed has led to a -6.4% annualized return over this period.

What happened?  Similar to what we just experienced in the US, the late 1980s in Japan saw monetary inflation that led to tremendous asset price inflation in both residential real estate and equity markets.  The government reaction after the bubble burst was very similar to the US government’s reaction to date.  The Japanese government propped up insolvent banks and built bridges to nowhere.  It redistributed existing wealth rather than allowing creative destruction to work its magic by purging excess and encouraging new development.  While Japan did use monetary policy to combat deflation, it was far less aggressive than the US has been to date and a period of mild price deflation has persisted.

The economic ramification of the analogy are clearly quite negative, but there are several additional insights investors might find useful:

  • Valuation matters.  Despite very poor overall stock market returns for the period of -6.4%, our friends at the Applied Finance Group demonstrate here (slide 15) that investors who purchased the “cheapest” quintile of stocks each year were able to achieve a 6% positive return thus beating the “market” by over 12% annually.
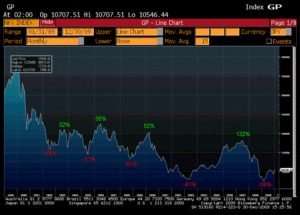
  • Overvaluation, leverage, and excessive government intervention lead to volatility.  Volatility creates opportunities as the following graph shows with the Japanese market experiencing 5 sell-offs of greater than 30% and 4 rallies of greater than 30% over the twenty year period.
  • Unlike Japan, the US Federal Reserve has an incentive-caused bias to inflate.  One might conclude that Japan got mild deflation because that is exactly what they wanted.  Japan is a nation of net-savers, while the US is the largest debtor nation.  Savers loath inflation because the value of their bond coupons become less and less valuable.  Debtors love inflation because the value of their debt is less and less.  (Now, before one concludes that the Fed’s aggressive monetary policy will be our saving grace, it is important to remember that real growth is all that matters from the standpoint of wealth and improved living standards and all that inflation achieves is nominal growth with the very negative side-effect of mal-investment.)

In conclusion, we think that while not a perfect analogy (owing to distinct demographic, immigration, and consumer behaviors to name just a few differences), the last twenty years in Japan provide a very useful template to inform current investment decisions in US markets.  We believe a process that is oriented toward value investing, displays the patience to wait for the market to present opportunities, and is mindful of the damaging impact of an unstable currency has the potential to offer both positive absolute and relative returns in even these very challenging conditions.