One Question for Messrs Buffett and Munger

Tomorrow, Saturday May 2nd, 2015, Warren Buffett and Charlie Munger will hold court over a crowd of 40k+. As they do every year, they will spend several hours answering questions about the current and future workings of Berkshire Hathaway. Three journalists and three investment analysts will ask the questions.

If we were given the opportunity to ask a question, we would focus on Berkshire Hathaway Energy -BHE – (formerly MidAmerican Energy) and the threat to traditional utility businesses from distributed generation (DG).

During 2014, BHE provided 9% of Berkshire’s revenue and 11% of pre-tax operating earnings. In the most recent annual letter, Mr. Buffett refers to BHE as one of the “Powerhouse Five” collection of Berkshire’s largest non-insurance businesses. He goes on to write, “a century hence, BNSF and Berkshire Hathaway Energy will still be playing vital roles in our economy.” Later, he adds that BHE has “recession-resistant earnings, which result from these companies offering an essential service on an exclusive basis.”

Their conviction is very high. We wonder if both Messrs Buffett and Munger are underestimating the potential threat from distributed generation (i.e. power generated at the individual household level using solar technology). Is it possible that the developments in Hawaii described in detail in a recent NYTimes article are just the beginning?

BHE has invested $15B in renewable energy generation capabilities and is the largest generator of renewable energy in the US. In addition BHE’s largest subsidiaries are in geographies with no immediate threat (the ratio of sunlight to traditional generation fuel cost is favorable). Yet, solar is not a typical fuel source. It is a technology that behaves according to Moore’s Law – every year it is twice as efficient and half the price as the previous year.

So, if we had the floor for a minute in Omaha tomorrow, here is what we would ask: “Messrs Buffet and Munger, what if technology made it so BHE was no longer the exclusive provider of power in its covered geographies? Doesn’t solar offer the possibility that the distribution component of the regulated utility industry shrinks significantly in size? BHE uses solar as a fuel source, but that alone can’t neutralize the threat. Solar has the potential to be much more than a substitute for coal or gas in the old utility regime. Centralized power generation isn’t necessarily ideal. In the past it was just the only practical option. Today, decentralized power generation is just as practical in a few locations (e.g. Hawaii), but it is becoming so in more and more geographies by the year. The efficiency of solar is increasing and the cost decreasing at a rate commensurate with Moore’s Law – and it should, as solar panels are similar in structure to computer chips. As this trend continues, individual solar power generation will become practical in more and more locations. And so, how can you be so confident in BHE’s ability to earn a “good” return long into the future? Is it possible that solar may be to the utility industry what the internet was to the newspaper business?”

We remain long $BRK, confident in the overall business mix, the broad diversification, and the “moat” that accrues from the structure Mr. Buffett has developed over the last 50 years. We are also optimistic that BHE managers can adjust the business to new realities over time. Still, we would like to hear some additional details on how they think about the distributed generation threat.

Long $BRK.
Why Margin Debt Matters

Margin debt is not a useful tool for market timing, but it does help to describe the general stability of the financial system.

(This article first appeared on Seeking Alpha on Jan 31, 2014.)

For the past few months, cautious investors, perma-bears, or reasonable skeptics (depending on your point of view) have emphasized the rise of margin debt balances to historic highs as one more sign that “all the passengers are on one side of the boat.” In a January 27 post, Zero Hedge’s “Tyler Durden” wrote, “margin debt rose by another $21 billion in December to an all time high of $445 billion, and up 29% from a year ago.” He goes on to explain how grossly understated this number is given hedge funds’ ability to borrow beyond traditional margin limits. Dr. John Hussman of the eponymous Hussman Funds wrote of surging margin debt at least as far back as April, 2013. Even the more staid Wall Street Journal has published warnings about the rise in margin debt. For example, the October 24, 2013 Morning MarketBeat was titled Risky Business of Rising Margin Debt.

Yet, in a December 20, 2013 commentary, technical analysis service Lowry Research Corporation points out that “since market tops are always a reflection of excessive risk-taking, it is reasonable to expect margin debt to be at high levels near major market tops. But, that does not mean it is an effective or accurate tool for anticipating major market tops. History shows that margin debt was at record levels for each of 19 years, from 1950 to 1969 and for each of 25 years, from 1976 to 2000.”

So, does margin debt matter? We believe the answer is yes. While it may not be a useful tool for market timing, it does help to describe the general stability of the financial system – particularly when viewing margin debt expressed as a percentage of a normalizing variable such as gross domestic product (GDP). The greater the margin debt as a percentage of the system, the less stable the system is.

Why is margin debt destabilizing? There are several reasons:

  1. Margin debt is a loan that can be called at any time. Imagine how precarious the housing market would be if your bank could call you on Monday morning and tell you to pay off your mortgage by the middle of the week or they would start selling the windows and doors on your home.
  2. The higher margin debt becomes as a percentage of financial assets, the smaller the selloff in financial assets needed to cause the margin clerk to make the above-described call. Traditional margin loans are governed by Regulation T. This allows investors to borrow against 50% of their capital initially. Therefore, an investor with $100 could make a $200 investment. Importantly, the investor must maintain at least a 25% capital ratio. So, if that $200 investment went down more than 33%, the margin clerk is calling. Unfortunately, this oversimplifies the issue. Institutional investors can use far more leverage and the margin call is governed by more than just Regulation T’s maintenance requirement. If a large brokerage firm gets nervous and wants to take down their loan balance, they can make a margin call. If they don’t like the type of collateral being held (maybe momentum stocks like AMZN, or NFLX, or YELP) they can make a margin call. To use the home analogy again, it would be as if your bank could require you to repay your mortgage if they were worried a hurricane was headed towards your neighborhood.
  3. When margin debt is high enough, selling begets selling. It could work like this. a) Some broker-dealer(s) get over-extended by lending against a class of securities that proves to have much more downside volatile than they originally expected. As these assets selloff, the firm(s) begin to call in margin loans. b) The portfolio managers getting the margin call sell securities into a falling market in order to pay off their loans. c) The additional selling causes the market to go down more. d) Go back to a) until such time as the system is unlevered and securities are primarily owned without debt.

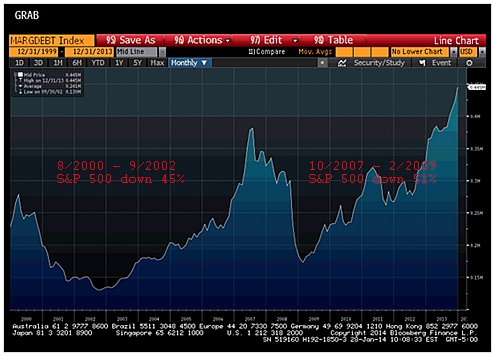
Thus, while neither absolute margin debt levels nor margin debt as a percent of GDP may be good market timing indicators, significant margin debt IS emphatically a sign that the system is unstable. We submit the following chart of the two most recent margin debt peaks as evidence.

margindebt

This graph, created using Bloomberg Financial, shows the absolute dollar amount of margin debt from the end of 1999 through the end of 2013. At the margin debt trough in September 2002, the S&P 500 had fallen 45% from its August 2000 level. At the margin debt trough in February 2009 the S&P 500 had fallen 51% from its October 2007 level.

The information contained herein should not be construed as personalized investment advice.  Past performance is no guarantee of future results.  There is no guarantee that the views and opinions expressed in this blog will come to pass.  Investing in the stock market involves the potential for gains and the risk of losses and may not be suitable for all investors.  Information presented herein is subject to change without notice and should not be considered as a solicitation to buy or sell any security.

A complete list of recommendations by Grey Owl Capital Management, LLC may be obtained by contacting the adviser at 1-888-473-9695.

Traditional Retail will Continue to be Damaged by E-Commerce*

I recently had a “shopping” experience that has caused me to really question the economics of big box retailers.  Like many men when it comes to shopping I am more of a hunter than a gatherer.  When I need something I find my prey, I hunt it down and metaphorically kill it.  I do not spend any time looking around for other bargains or do much comparison shopping.  Until now.

With the advent of the internet, comparison shopping that once took hours can now be accomplished in minutes, from the comfort of your home or office.  My recent experience involved the purchase of a cordless phone system for my home.  Specifically we needed a two-line cordless phone system that would support multiple handsets.  I found myself at Staples for another reason, and the phone display in the store triggered me to recall our need and take a look.  A sales associate quickly approached me and asked about my needs.  Of the two options I was considering he gave his opinion and helped me make my choice.  In the process I was thinking I should check on Amazon to see what the price differential was, but I decided to buy first and then check.  In this day and age how much different could it be?  Everyone on the planet is aware of online commerce, right? Retailers have their own online capabilities, and are certainly aware of the price competition.  I decided that if it was $10-15 difference the convenience of the store would be worth it.  I also had 14 days to return the items.  Boy was I wrong.

The items I purchased from Staples for $230 ended up costing me $168 on Amazon.  Part of the difference was taxes, most of it was price.  As an Amazon Prime member shipping was free, so you might add some small shipping cost to compare apples-to- apples.  No matter how you slice it the difference is dramatic.  My cost was $62 less on Amazon for the identical items.  Put another way, the cost at Staples was 37% higher than Amazon.  No contest.  The items were returned to Staples before noon the next day.

The full impact of the shift to e-commerce has not yet been felt.  As time goes on, the first place people will look for items will be the internet, rather than as an alternative.  Granted, the online experience is not appropriate for all types of purchases.  If you are uncertain about size or fit, returning items can add to the cost and be a hassle.  But ultimately the lower cost will erode the already thin profit margins of big retailers.  Big box retailers will require less floor space and possibly fewer locations.  Retail real estate will need to adapt.  Investors need to consider this with every potential purchase.

*This discussion should not be construed as a recommendation to buy or sell Staples or Amazon.

Transfer Payments – Path to Recovery or Fast-lane to Sovereign Debt Crisis?

While the increasing role of transfer payments to shore up personal income and stabilize consumer spending has long been recognized by the more circumspect economic observers throughout the recent recession and “recovery,” the observation has now gone main stream.  Last week, the USA Today ran an article titled Private pay shrinks to historic lows as gov’t payouts rise.

Those questioning the veracity of the term “recovery” as it applies to the current economic situation in the United States (or at least those who question the strength and sustainability of said recovery) point to the fact that absent transfer payments, real personal income is stuck at a trough level.

Why is the source of personal income important?  Earned income (from wages or investment yield) allows people to save, invest, and consume.  The government can also redistribute a portion of this income to others who are not working so that they too can save, invest, and consume.   Absent sufficient tax receipts, the government can borrow money in order to make transfer payments.  However, the government can only borrow and transfer for so long.  Eventually there needs to be real productive work that can be taxed in order to pay back the debt.

The USA Today article does a great job of presenting the facts and then presenting opinions on the implications of the facts, overtly mentioning the political orientation of the person opining.    Talk about fair and balanced.

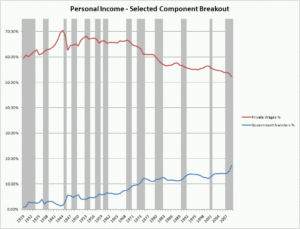
Paul Van De Water, an economist at the liberal (the USA Today’s word choice, not mine) Center on Budget and Policy Priorities, argues that the system is working as designed – “stimulating growth and helping people in need.”  If that is the case, one would expect to be able to look at a historic chart of transfer payments and see them increase during recessions and decrease afterward.  80 years of data show that about half of the time, this is true.  However, the same 80-year chart shows a secular increase in the percentage of personal income coming from transfer payments and a mirror-image, secular decline in the percentage of personal income coming from wages.

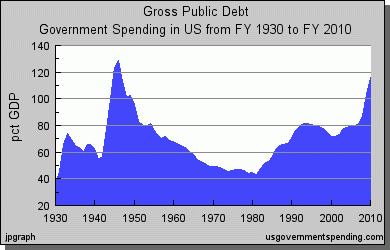
The rapid rise in gross public debt shows that the latest increase in transfer payments is not being funded from tax dollars, but rather from borrowing.  It will need to be paid back.

PublicDebt

Keen-eyed readers will note that the current level of gross public debt is not unprecedented.  A similar debt spike occurred in the 1940s as the government borrowed money to fund our efforts in WWII.  However, some of this spending built infrastructure and manufacturing assets that were later retooled from war use to productive commercial use.  One can’t say the same of transfer payments that mostly fund consumption.  Perhaps more importantly, the gross public debt in the late 1940s was near an exhaustive accounting of public debt.  Today, there is an order of magnitude more debt ($100T) held “off balance sheet” in the form of “unfunded liabilities” for future promised transfer payments.

It is unclear if we have reached a tipping point, but we know for sure we grow closer by the day.  Uncertainty abounds – investors must remain nimble.

You want China to float the Yuan (RMB)? Be careful what you wish for…

On Monday, a bipartisan group of 130 members of the U.S. House of Representatives sent a letter to Treasury Secretary Timothy Geithner and Commerce Secretary Gary Locke urging the agencies to use “all available resources” to end what they view as damaging currency manipulation by China.  The full text of the letter can be found here:  http://wallstreetpit.com/19954-china-manipulates-its-currency-say-130-congressmen

The letter states “By pegging the renminbi (RMB) to the U.S. dollar at a fixed exchange rate, China unfairly subsidizes its exports and disadvantages foreign imports”.   True, but who do they think is benefiting from the subsidy?  The congressmen are overlooking the fact that by allowing Chinese manufacturers to sell goods for less it allows American consumers to BUY goods for lower prices.  It is the U.S. consumer that is ultimately receiving the subsidy, not Chinese manufacturing companies.  Be careful what you wish for: a higher RMB/USD exchange rate would lead to higher real costs for all U.S. consumers.

These Congressmen are playing up to concerned workers, while ignoring the fact that every single one of their constituents that purchases goods made in China benefits from this subsidy.  The letter states that “China’s exchange-rate misalignment threatens the stability of the global financial system by contributing to rampant Chinese inflation and accumulation of foreign reserves.”  Where do they think the inflation will go if not to China?  It would stay here, is where.  In 2009, the U.S. trade deficit with China was $226 billion.  Personal consumption expenditures were a bit over $10 Trillion.  So, the trade deficit with China was 2.2% of personal consumption.  If the RMB were to appreciate by 20%, it would amount to an increase in costs of $45 Billion or .4% of personal consumption.  This back-of-the-envelope calculation indicates that a 20% increase in the RMB would increase consumer price inflation by roughly .4%.   Be careful what you wish for: a higher RMB/USD exchange rate would lead to higher inflation in the U.S.

The direct assertion of the letter is that if the U.S. places tariffs and regulations on China then the goods being manufactured there will be manufactured in the U.S. and put unemployed workers back to work.  In reality the U.S. and China are not the only place where commerce can flow.  In all likelihood, restricting the flow of goods from China will lead to those goods coming in from other lower cost countries like India, Mexico, or Malaysia.  Are we then going to place tariffs and restrictions on imports from EVERY country in an effort to reduce unemployment?  This might be popular with the press, but it would  act like a large tax on consumers.

The final unintended consequence of pushing the Chinese to revalue their currency relates to the large “accumulation of foreign reserves” by the Chinese.  China has used $889 Billion of their reserves to purchase U.S. Treasury obligations, making them the largest foreign holder of our debt.  This is up from $739 Billion just one year ago.  In the absence of China’s willingness to acquire our excessive debt, the United States would have to pay higher interest rates to attract other lenders.  Be careful what you wish for: a higher RMB/USD exchange rate would lead to higher risk-free interest rates, which impacts rates for almost every borrower.

In summary, strong-arming China to revalue their currency, while perhaps politically popular, would have several adverse unintended consequences: higher real costs, higher inflation, and higher interest rates.  We say, let the Chinese continue to peg the RMB to the U.S. dollar.  On balance it is considerably more helpful than hurtful to the U.S. at China’s expense.  Be careful what you wish for.

On Buffett’s Berkshire Primer

This past Saturday, Warren Buffett released Berkshire Hathaway’s 2009 annual report and his annual letter to Berkshire shareholders.*  The last Friday in February has become like Christmas Eve for value investors the world over.  A night of tossing and turning is followed by a mad rush to the computer to download the latest version at 8am on Saturday morning.  And then, maybe 30 minutes later, melancholy as we all realize that Mr. Buffett won’t write to us again for 365 days.  As admirers of Mr. Buffett, frequent shareholders, and practitioners of the “value” approach to investing, you could count us among the sleep deprived on February 27th.

Given Berkshire’s recent (and massive) acquisition of Burlington Northern Santa Fe, Mr. Buffett chose to make this year’s letter a primer on the various Berkshire business lines, as well as his value-oriented approach to investing.  Here are a few thoughts on areas we found particularly interesting:

  • Berkshire’s stated book value was $84,487 / share (page 3).  Investments totaled $59,034mm with a cost basis of $34,646.  If one were to mark these investment to market and then subtract 20% for capital gains taxes (estimate of federal and state), Berkshire’s book value is just over $97,000 / share.  As of the close on March 2, 2010, the stock traded at $121,740 or 1.26x “adjusted” book value.
  • Mr. Buffett has always shunned excessive leverage and talked about its many risks.  He often admits that during good times the company’s equity might underperform more leveraged entities.  “Sleeping well at night” is the reason he usually provides for this strategy.  True enough, but 2008 demonstrated that over a full cycle, low leverage entities such as Berkshire can outperform because they are able to provide liquidity precisely when no one else can and in doing so receive outsized compensation.  As he writes on page 4 of the letter, “When the financial system went into cardiac arrest in September 2008, Berkshire was a supplier of liquidity and capital to the system, not a supplicant.  At the very peak of the crisis, we poured $15.5 billion into a business world that could otherwise look only to the federal government for help.”
  • The 17th century philosopher Frederic Bastiat spoke of “what is seen and what is not seen” in regards to the unintended consequences of laws on the economic sphere.  Mr. Buffett recognizes similar risks in over handed management and thus promotes an organizational approach at Berkshire that is as laissez-faire as the political approach recommended by Bastiat.  On page 5, Mr. Buffett states, “We would rather suffer the visible costs of a few bad decisions than incur the many invisible costs that come from decisions made too slowly – or not at all – because of a stifling bureaucracy.”
  • In the Insurance section beginning on page 6, Mr. Buffett states the two critical aspects of the insurance business:  1) fairly unique in business, insurance operates on a “collect-now, pay-later model” and thus requires “negative” working capital – called “float” and  2) because enough people have recognized how favorable these economics are, the insurance industry as a whole operates at an underwriting loss.  Berkshire offers shareholders a unique proposition:  the firm has demonstrated an ability to invest the “float” in a very profitable way AND because of the superior managers and compensation structure the Berkshire insurance companies operate under, the firm has consistently operated at an underwriting profit.
  • In the Utilities section, which begins on page 8, Mr. Buffett provides insight into why Berkshire is now willing to own such capital-intensive business when in the past they avoided them.  Two explanations are given:  1) today, Berkshire is so big that Mr. Buffett has no choice but to look at opportunities he would have passed on before and 2) given the regulated nature of utilities, Mr. Buffett seems to believe that he is trading some investment upside for greater certainty.  This makes sense to us.  Other investors and financial writers (including Whitney Tilson) have articulated a third possibility:  because Berkshire pays a “negative” rate on its borrowings (i.e. “float”) investments that would be unprofitable for others can be profitable for them.
  • The housing market makes its way into the letter on page 12 in the Finance and Financial Products section.  Given the lowest-in-fifty-years 2009 housing start number, Mr. Buffett believes that “within a year or so residential housing problems should largely be behind us.”  While he is correct in stating that 2009’s 554k starts is well below the 1.2mm annual housing formation number, we think his optimism might be a bit premature.  The recession has probably lowered the annual housing formation number and published inventory numbers are too low when bank “real estate owned” is considered.
  • Mr. Buffett then discusses the structural problems at Clayton Homes that are a result of the government’s housing finance policy.  The government artificially lowers the interest rate for conventional mortgages.  Therefore, when financing is considered, a traditional home can be cheaper than the manufactured houses sold by Clayton.  Mr. Buffett doesn’t say this but this is another example of Bastiat’s “not seen.”  It also reminds us that in the current climate, government interference must be a part of the investment calculus.
  • Berkshire is unlikely to experience the damaging impact of “group think.”  In describing Berkshire’s derivative contracts, Mr. Buffett (on pages 15 and 16) assures shareholders that these contracts neither expose Berkshire to extreme leverage nor to counterparty risk.  “If Berkshire ever gets in trouble, it will be my fault.  It will not be because of misjudgments made by a Risk Committee or Chief Risk Officer.”
  • Mr. Buffett concludes the financial section with a well-deserved excoriation of financial company CEOs and directors.  However, regarding his defense of investors against the “bail-out” claim, we offer one final quibble with Mr. Buffett.  He states, “Collectively, they [shareholders of the largest financial institutions] have lost more than $500 billion in just the four largest financial fiascos of the last two years.  To say these owners have been “bailed-out” is to make a mockery of the term.”  If he is using the term “owners” very explicitly, then, with the exception of Bear Stearns shareholders, perhaps he is correct.  However, he leaves out the fact that bond holders of these same insolvent institutions, who knowingly assumed the risk of capital loss, were in fact bailed out to the tune of hundreds of billions of dollars and made whole by taxpayers.

That wraps up the highlights as we see them.  However, the whole letter is well worth reading and it is available here:  http://www.berkshirehathaway.com/letters/2009ltr.pdf

*This discussion should not be construed as a recommendation to buy or sell Berkshire Hathaway.

Is Japan the Correct Analogy?

Yesterday’s Financial Times featured an analysis by Lindsay Whipp titled “A gloomy anniversary for the Nikkei.”  Most investors already know the punchline:  The Nikkei, Japan’s primary stock market index, reached a peak of 39,000 twenty years ago.  Today, the index hovers in the mid-10,000s, almost three quarters below its peak.  Given the United States’ similar issues with high levels of debt, stock market (over) valuation, as well as similar monetary and fiscal responses to “fix” the initial credit crisis, investors in US equities should ask the question, is Japan the correct analogy?

Unfortunately, in many ways Japan does appear to be a reasonable corollary.  Post World War II, from 1950-1970, Japan’s GDP grew at a real rate of 8.4% annually on a per-capita basis.  It slowed to a still stellar 4.1% rate from 1970-1990.  Then, the bubble burst and from 1990-2004 Japan’s economy grew at an average rate of 1%.  The Japanese market’s slow bleed has led to a -6.4% annualized return over this period.

What happened?  Similar to what we just experienced in the US, the late 1980s in Japan saw monetary inflation that led to tremendous asset price inflation in both residential real estate and equity markets.  The government reaction after the bubble burst was very similar to the US government’s reaction to date.  The Japanese government propped up insolvent banks and built bridges to nowhere.  It redistributed existing wealth rather than allowing creative destruction to work its magic by purging excess and encouraging new development.  While Japan did use monetary policy to combat deflation, it was far less aggressive than the US has been to date and a period of mild price deflation has persisted.

The economic ramification of the analogy are clearly quite negative, but there are several additional insights investors might find useful:

  • Valuation matters.  Despite very poor overall stock market returns for the period of -6.4%, our friends at the Applied Finance Group demonstrate here (slide 15) that investors who purchased the “cheapest” quintile of stocks each year were able to achieve a 6% positive return thus beating the “market” by over 12% annually.
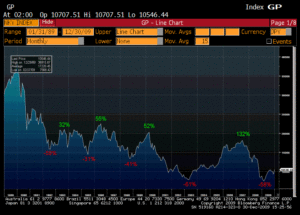
  • Overvaluation, leverage, and excessive government intervention lead to volatility.  Volatility creates opportunities as the following graph shows with the Japanese market experiencing 5 sell-offs of greater than 30% and 4 rallies of greater than 30% over the twenty year period.
  • Unlike Japan, the US Federal Reserve has an incentive-caused bias to inflate.  One might conclude that Japan got mild deflation because that is exactly what they wanted.  Japan is a nation of net-savers, while the US is the largest debtor nation.  Savers loath inflation because the value of their bond coupons become less and less valuable.  Debtors love inflation because the value of their debt is less and less.  (Now, before one concludes that the Fed’s aggressive monetary policy will be our saving grace, it is important to remember that real growth is all that matters from the standpoint of wealth and improved living standards and all that inflation achieves is nominal growth with the very negative side-effect of mal-investment.)

In conclusion, we think that while not a perfect analogy (owing to distinct demographic, immigration, and consumer behaviors to name just a few differences), the last twenty years in Japan provide a very useful template to inform current investment decisions in US markets.  We believe a process that is oriented toward value investing, displays the patience to wait for the market to present opportunities, and is mindful of the damaging impact of an unstable currency has the potential to offer both positive absolute and relative returns in even these very challenging conditions.

The Deeper the Slump, the Stronger the Recovery?

In September, (seemingly perma) bear Jim Grant announced his bullish turn in the Wall Street Journal.  He summarized the core of his argument by quoting Michael T. Darda, chief economist of MKM Partners.  We repeat the quote here:  “The most important determinant of the strength of an economic recovery is the depth of the downturn that preceded it.  There are no exceptions to this rule, including the 1929-1939 period.”

Mr. Grant continues by pointing out that inhospitable government action does not provide a reasonable argument against a snap-back, as the mid-30s showed four years of close to 10% annual expansion despite Roosevelt’s anti-business activities.  In addition, the combination of government fiscal and monetary stimulus this go-around is 19.5% of GDP compared to the average recessionary government response that has measured just 2.9% of GDP.

Mr. Grant finds himself in good company.  Close to the market trough in April 2009, Ben Inker of GMO published a piece titled “Valuing Equities in an Economic Crisis.”  The crux of this piece is that it is relatively easy to value a broad index given the long-term stability of the economy.  The US economy has always gotten back to its long-term growth trend following recessions, including the Great Depression.  Mr. Inker points out that the 1929 25% fall in real GDP “was a fall in demand relative to potential GDP, not a fall in the economy’s productive capacity, and so the economy eventually got back onto its previous growth trend as if the Depression had never happened.”

These arguments certainly have merit.  Not only do they come from some of the investment world’s preeminent thinkers, they also make logical sense.  However, from an investment process standpoint they highlight a common analytic error:  focusing on experience versus exposure.  (This is the same analytic error that led people to believe that because country-wide housing prices had never fallen on an annual basis, they never would.)

Which leads us to ask the question, what is our exposure if we follow this line of thinking?  Most importantly, these analyses focus on the US economy.  (Mr. Inker does make reference to the rebound of Japan and Germany post WWII, but not much detail is provided and like the US period cited, these were 20th Century industrialized economies.)  Interestingly, Samuel Brittan wrote a piece a couple of weeks ago in the Financial Times saying “Goodbye to the pre-crisis trend line” citing an IMF analysis that included a much broader swath of global recessions.  Mr. Brittan points out that this analysis tells a far different story from Mr. Grant’s and Mr. Inker’s:  “much of the loss of output in a severe recession is permanent and that the economy never gets back to its old trend line.”

In conclusion, while Mr. Grant and Mr. Inker may be proven correct and the US may experience an extraordinarily powerful recovery to match the recent downturn, making a binary investment decision based on that hypothesis does not take into account one’s exposure.  (If looking beyond the US, it does not even appear to take into consideration experience.)  With total US debt still at very high levels and anemic fixed private investment (to name just two systemic issues), betting on a strong economic recovery based solely on the depth of the slump does not appear to us to provide a necessary “margin of safety.”

Greenlight’s Einhorn Allows Us to Learn from His Mistakes

David Einhorn is a value investor with an excellent track record and a willingness to take controversial stands against powerful interests (that have frequently proven correct).  He is also willing to engage in public critique of his own investment process, which allows us all to learn vicariously from his mistakes.  He recently presented at the Value Investing Congress and made the following very relevant points.

  1. Regarding specific investments where he ignored the macro-picture (i.e. the housing bubble).  “The lesson that I have learned is that it isn’t reasonable to be agnostic about the big picture.”  Einhorn goes on to say that this does not mean that individual security selection is irrelevant, but rather that an investment process that combines top-down and bottom-up analysis is best.
  2. On why politicians are continuing to kick the can down the road regarding the nation’s fiscal imbalance.  Two basic problems with our government: a) the need to get re-elected (or stay appointed) makes politicians short-term oriented and b) special interests drive the agenda because the benefits of their initiatives are concentrated and the costs are spread out so much that no individual feels too much pain.
  3. On the right approach to the economic crisis and an alternative theory for the 1938 double-dip recession.  Einhorn points out that GDP grew 17% in 1934, 11.1% in 1935, and 14.3% in 1936, yet the current powers that be warn that removing stimulus too soon caused a double-dip recession in 1938.  His theory:  “An alternative lesson form the double dip the economy took in 1938 is that the GDP created by massive fiscal stimulus is artificial.”
  4. On the results of the government’s largess.  “I believe that the conventional view that government bonds should be ‘risk free’ and tied to nominal GDP is at risk of changing.  Periodically, high quality corporate bonds have traded at lower yields than sovereign debt.  That could happen again.”

The full speech is worth reading and is available here.