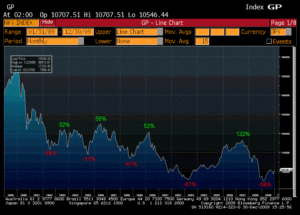
Yesterday’s Financial Times featured an analysis by Lindsay Whipp titled “A gloomy anniversary for the Nikkei.” Most investors already know the punchline: The Nikkei, Japan’s primary stock market index, reached a peak of 39,000 twenty years ago. Today, the index hovers in the mid-10,000s, almost three quarters below its peak. Given the United States’ similar issues with high levels of debt, stock market (over) valuation, as well as similar monetary and fiscal responses to “fix” the initial credit crisis, investors in US equities should ask the question, is Japan the correct analogy?
Unfortunately, in many ways Japan does appear to be a reasonable corollary. Post World War II, from 1950-1970, Japan’s GDP grew at a real rate of 8.4% annually on a per-capita basis. It slowed to a still stellar 4.1% rate from 1970-1990. Then, the bubble burst and from 1990-2004 Japan’s economy grew at an average rate of 1%. The Japanese market’s slow bleed has led to a -6.4% annualized return over this period.
What happened? Similar to what we just experienced in the US, the late 1980s in Japan saw monetary inflation that led to tremendous asset price inflation in both residential real estate and equity markets. The government reaction after the bubble burst was very similar to the US government’s reaction to date. The Japanese government propped up insolvent banks and built bridges to nowhere. It redistributed existing wealth rather than allowing creative destruction to work its magic by purging excess and encouraging new development. While Japan did use monetary policy to combat deflation, it was far less aggressive than the US has been to date and a period of mild price deflation has persisted.
The economic ramification of the analogy are clearly quite negative, but there are several additional insights investors might find useful:
- Valuation matters. Despite very poor overall stock market returns for the period of -6.4%, our friends at the Applied Finance Group demonstrate here (slide 15) that investors who purchased the “cheapest” quintile of stocks each year were able to achieve a 6% positive return thus beating the “market” by over 12% annually.
- Overvaluation, leverage, and excessive government intervention lead to volatility. Volatility creates opportunities as the following graph shows with the Japanese market experiencing 5 sell-offs of greater than 30% and 4 rallies of greater than 30% over the twenty year period.

- Unlike Japan, the US Federal Reserve has an incentive-caused bias to inflate. One might conclude that Japan got mild deflation because that is exactly what they wanted. Japan is a nation of net-savers, while the US is the largest debtor nation. Savers loath inflation because the value of their bond coupons become less and less valuable. Debtors love inflation because the value of their debt is less and less. (Now, before one concludes that the Fed’s aggressive monetary policy will be our saving grace, it is important to remember that real growth is all that matters from the standpoint of wealth and improved living standards and all that inflation achieves is nominal growth with the very negative side-effect of mal-investment.)
In conclusion, we think that while not a perfect analogy (owing to distinct demographic, immigration, and consumer behaviors to name just a few differences), the last twenty years in Japan provide a very useful template to inform current investment decisions in US markets. We believe a process that is oriented toward value investing, displays the patience to wait for the market to present opportunities, and is mindful of the damaging impact of an unstable currency has the potential to offer both positive absolute and relative returns in even these very challenging conditions.